CCC comparison between US and Japan for FY2025
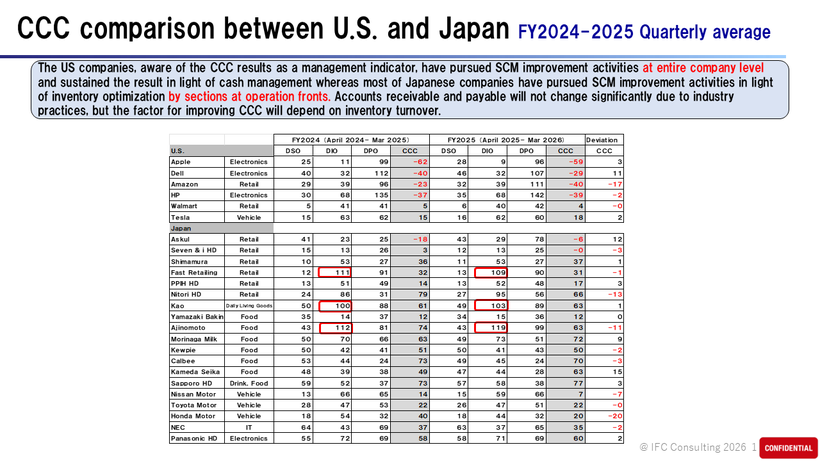
CCC comparison between US and Japan for FY2024-2025
In general the economy is on the road to recovery and sales have been recovering over the past year, and CCC has been stable. Regarding CCC, the comparison between Japan and the United States has a big difference in the number of days of inventory turnover.
In terms of CCC (Cash Conversion Cycle) and working capital, it turned out that U.S. leading companies are well managed.
It is essential to check working capital along with CCC to verify the status of cash position according to budget, forecast as well.
CCC = Accounts Receivable turnover + Inventory turnover – Accounts Payable turnover
Working Capital = Accounts Receivable + Inventory - Accounts Payable
<US Companies>
The characteristics of US companies are low inventory turnover days and high accounts payable days. CCC remains stable despite of sales volatility
Apple: Sales up by 13% (CCC +3 days, Working Capital +8%) Inventory -2 day
Dell: Sales down by 39% (CCC +11 days, WC +16%) Inventory +0 day
Amazon: Sales up by 14% (CCC -17 day, WC -1968%) Inventory +0 day
HP: Sales up by 29% (CCC -2 days, WC -13%) Inventory +0 day
Walmart: Sales up by 6% (CCC -0 day, WC +2%) Inventory -1 day
Tesla: Sales up by 2% (CCC +3 days, WC +15%) Inventory -1 day
<Japanese leading companies- CCC viewpoints>
Accounts receivable and payable will not change significantly due to industry practices, but the factor for improving CCC will depend on inventory turnover.
Askul: Sales down by 15% (CCC +12 days, Working Capital +216%) Inventory +6 days
Seven & i HD: Sales down by 13% (CCC -3 days, WC +4%) Inventory +0 day
Shimamura: Sales up by 5% (CCC +1 day, WC +4%) Inventory +0 day
Fast Retailing: Sales up by 11% (CCC -1 days, WC +9%) Inventory -2 days
PPIH: Sales up by 8% (CCC +3 days, WC +22%) Inventory +1 day
Yamazaki Baking: Sales up by 6% (CCC +0 day, WC +5%) Inventory +1 day
Toyota Motor: Sales up by 6% (CCC +0 day, WC -6%) Inventory +0 day
Panasonic HD: Sales down by 5% (CCC +2 days, WC -1%) Inventory -1 day
In order to build a corporate structure that responds to change, it is necessary to manage change points by narrowing the pitch rather than managing goals. To that end, it is urgent to align the common operation cycle weekly, chain conventional management indicators (financial indicators and non-financial indicators) and manage the cockpit with the idea of the Balanced Scorecard.
CCC comparison between US and Japan for FY 2024
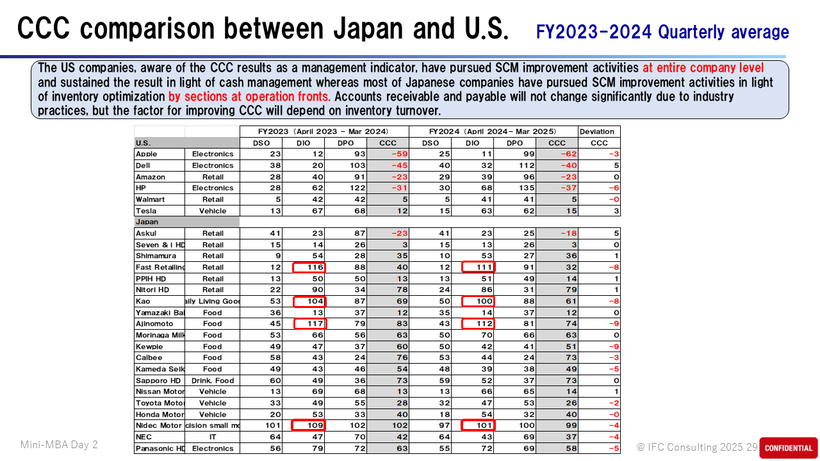
CCC comparison between US and Japan for FY2023-2024.
In general the economy is on the road to recovery and sales have been recovering over the past year, and CCC has been stable. Regarding CCC, the comparison between Japan and the United States has a big difference in the number of days of inventory turnover.
In terms of CCC (Cash Conversion Cycle) and working capital, it turned out that U.S. leading companies are well managed.
It is essential to check working capital along with CCC to verify the status of cash position according to budget, forecast as well.
CCC = Accounts Receivable turnover + Inventory turnover – Accounts Payable turnover
Working Capital = Accounts Receivable + Inventory - Accounts Payable
<US Companies>
The characteristics of US companies are low inventory turnover days and high accounts payable days. Although sales of each IT industry are tough in FY2023 closing around March/April 2024, the quarterly average working capital is well managed increased, confirming the strength of the financial position.
Apple: Sales up by 5% (CCC -3 days, Working Capital -1%) Inventory -1 day
Dell: Sales down by 7% (CCC +5 days, WC +8%) Inventory +12 days
Amazon: Sales up by 10% (CCC +0 day, WC +84%) Inventory -1 day
HP: Sales up by 29% (CCC -6 days, WC +10%) Inventory +6 days
Walmart: Sales up by 4% (CCC -0 day, WC +1%) Inventory -1 day
Tesla: Sales up by 1% (CCC +3 days, WC +26 day) Inventory -4 days
<Japanese leading companies- CCC viewpoints>
Accounts receivable and payable will not change significantly due to industry practices, but the factor for improving CCC will depend on inventory turnover.
Askul: Sales up by 4% (CCC +5 days, Working Capital -44%) Inventory +0 day
Seven & i HD: Sales up by 4% (CCC +0 day, WC +4%) Inventory -1 day
Shimamura: Sales up by 5% (CCC +1 day, WC +7%) Inventory -1 day
Fast Retailing: Sales up by 14% (CCC -8 days, WC -1%) Inventory -5 days
PPIH: Sales up by 8% (CCC +1 days, WC -28%) Inventory +16 days
Yamazaki Baking: Sales up by 4% (CCC +3 days, WC +3%) Inventory +1 day
Toyota Motor: Sales down by 0.4% (CCC -2 days, WC +3%) Inventory -2 days
Panasonic HD: Sales down by 0.5% (CCC -5 days, WC -6%) Inventory -7 days
In order to build a corporate structure that responds to change, it is necessary to manage change points by narrowing the pitch rather than managing goals. To that end, it is urgent to align the common operation cycle weekly, chain conventional management indicators (financial indicators and non-financial indicators) and manage the cockpit with the idea of the Balanced Scorecard.
CCC comparison between US and Japan for FY2023
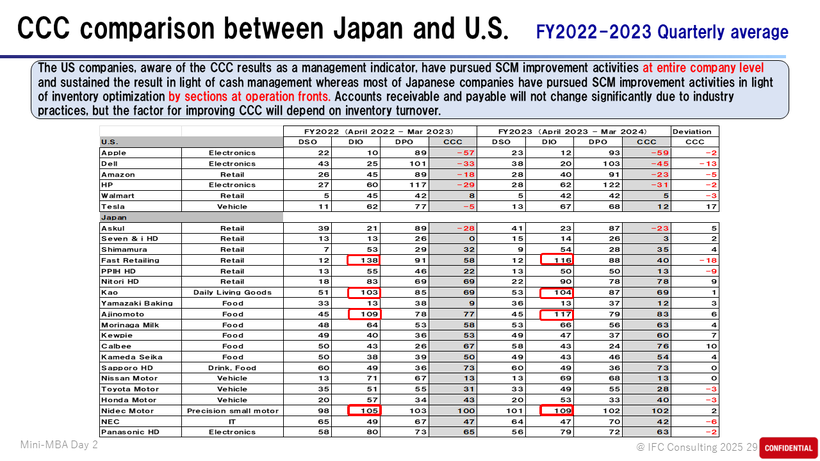
CCC comparison between US and Japan for FY2022-2023.
In general the economy is on the road to recovery and sales have been recovering over the past year, and CCC has been stable. Regarding CCC, the comparison between Japan and the United States has a big difference in the number of days of inventory turnover.
In terms of CCC (Cash Conversion Cycle) and working capital, it turned out that U.S. leading companies are well managed.
It is essential to check working capital along with CCC to verify the status of cash position according to budget, forecast as well.
CCC = Accounts Receivable turnover + Inventory turnover – Accounts Payable turnover
Working Capital = Accounts Receivable + Inventory - Accounts Payable
<US Companies>
The characteristics of US companies are low inventory turnover days and high accounts payable days. Although sales of each IT industry are tough in FY2023 closing around March/April 2024, the quarterly average working capital is well managed increased, confirming the strength of the financial position.
Apple: Sales down by 1% (CCC -2 days, Working Capital +4%) Inventory +2 days
Dell: Sales down by 8% (CCC +14 days, WC -57%) Inventory -5 days
Amazon: Sales up by 13% (CCC +12 days, WC +18%) Inventory -5 days
HP: Sales down by 6% (CCC +1 day, WC -5%) Inventory +2 days
Walmart: Sales up by 6% (CCC +2 days, WC -30%) Inventory -3 days
Tesla: Sales down by 1% (CCC +2 days, WC from minus to plus) Inventory +5 days
<Japanese leading companies- CCC viewpoints>
Accounts receivable and payable will not change significantly due to industry practices, but the factor for improving CCC will depend on inventory turnover.
Askul: Sales up by 4% (CCC +5 days, Working Capital +39%) Inventory +2 days
Seven & i HD: Sales down by 3% (CCC +2 days, WC +35%) Inventory +1 day
Shimamura: Sales up by 3% (CCC +4 days, WC -18%) Inventory 1 day
Fast Retailing: Sales up by 14% (CCC -18 days, WC -28%) Inventory -5 days
PPIH: Sales up by 7% (CCC -9 days, WC -28%) Inventory -5 days
Yamazaki Baking: Sales up by 10% (CCC +3 days, WC +28%) Inventory remains same
Toyota Motor: Sales up by 22% (CCC -3 days, WC +10%) Inventory -2 days
Panasonic HD: Sales up by 1% (CCC -2 days, WC -2%) Inventory -1 days
In order to build a corporate structure that responds to change, it is necessary to manage change points by narrowing the pitch rather than managing goals. To that end, it is urgent to align the common operation cycle weekly, chain conventional management indicators (financial indicators and non-financial indicators) and manage the cockpit with the idea of the Balanced Scorecard.
CCC comparison between US and Japan for FY2022
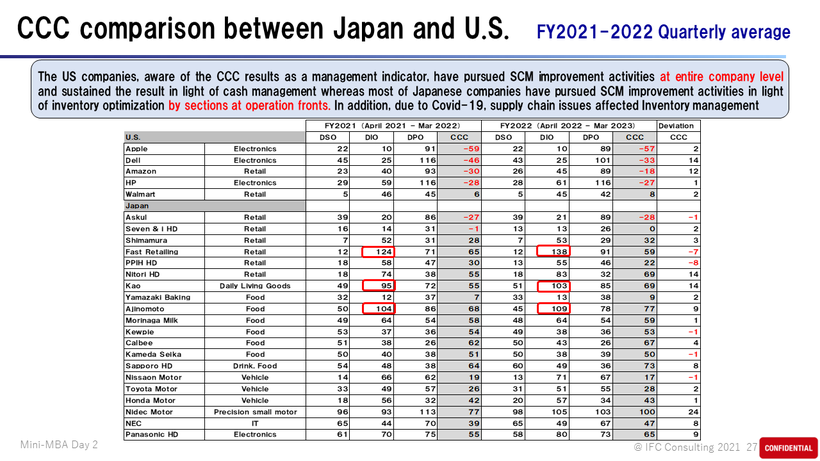
CCC comparison between US and Japan for FY2021
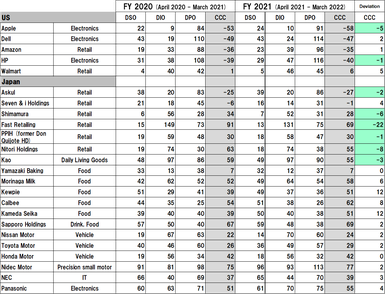
Sales have been recovering over the past year, and CCC has been stable. Regarding CCC, the comparison between Japan and the United States has a big difference in the number of days of inventory turnover.
In terms of CCC (Cash Conversion Cycle) and working capital, it turned out that U.S. leading companies are well managed.
It is essential to check working capital along with CCC to verify the status of cash position according to budget, forecast as well.
CCC = Accounts Receivable turnover + Inventory turnover – Accounts Payable turnover
Working Capital = Accounts Receivable + Inventory - Accounts Payable
<US Companies>
The characteristics of US companies are low inventory turnover days and high accounts payable days. Although sales of each company increased in FY2021 closing around March/April 2022, the quarterly average working capital increased slightly or decreased, confirming the strength of the financial position.
Apple: Sales up by 13% (CCC - 5 days, Working Capital - 25%) Inventory +1 day
Dell: Sales 17% up (CCC +2 days, WC - 23%) Inventory +5 days
Amazon: Sales 10% up (CCC +1 day, WC +18%) Inventory +6 days
HP: Sales 7% up (CCC -1 day, WC +2%) Inventory +9days
Walmart: Sales 2% up (CCC +5 days, WC+287%) Inventory +6 days
<Japanese leading companies- CCC viewpoints>
The characteristics of Japanese companies are fluctuating inventory turnover days while accounts receivable and accounts payable remains unchanged.
Seven & i HD: Sales 52% up (CCC +5 days, WC +7%) Inventory -4 days
Shimamura: Sales 8% up (CCC -6 days, WC -5%) Inventory -4 days
PPIH: Sales 8% up (CCC +0 day, WC +3%) Inventory -1 day
Fast Retailing: Sales 7% up (CCC -22 days, WC -14%) Inventory -18 days
Toyota Motors: Sales 16% up (CCC +2 days, WC +29%) Inventory +3 days
Yamazaki Baking: Sales 5% up (CCC+0 day, WC +2%) Inventory -1 day
Panasonic: Sales10% up (CCC +4 days, WC+17%) Inventory +7 days
In order to build a corporate structure that responds to change, it is necessary to manage change points by narrowing the pitch rather than managing goals. To that end, it is urgent to align the common operation cycle weekly, chain conventional management indicators (financial indicators and non-financial indicators) and manage the cockpit with the idea of the Balanced Scorecard.
CCC comparison between US and Japan for FY2020
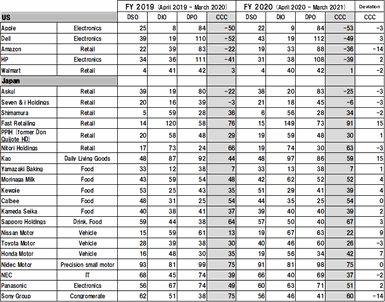
COVID-19 has significant impact on operations as well as finance from various aspects.
In terms of CCC (Cash Conversion Cycle) and working capital, it turned out that U.S. leading companies are well managed.
It is essential to check working capital along with CCC to verify the status of cash position according to budget, forecast as well.
CCC = Accounts Receivable turnover + Inventory turnover – Accounts Payable turnover
Working Capital = Accounts Receivable + Inventory - Accounts Payable
<US Companies>
The characteristics of US companies are low inventory turnover days and high accounts payable days. Although sales of each company increased in FY2020 closing around March 2021, the quarterly average working capital increased slightly or decreased, confirming the strength of the financial position.
Apple: Sales up
by 21% (CCC - 3 days, Working Capital - 30%) Inventory +1 day
Dell: Sales 5% up (CCC +3 days, WC + 9%) Inventory no change
Amazon: Sales 41% up (CCC -14 days, WC - 356%)
Inventory - 6 days
HP: Sales 7% up (CCC +2 days, WC + 1%) Inventory +2 days
Walmart: Sales 5% up (CCC -2 days, WC - 43%) Inventory - 1 day
<Japanese leading companies- CCC viewpoints>
The characteristics of Japanese companies are fluctuating inventory turnover days while accounts receivable and accounts payable remains unchanged.
Seven & i HD:
Sales 13% down (CCC -3days, WC -4%) Inventory +2 days
Shimamura: Sales 4% up (CCC -2 days, WC -5%) Inventory -3 days
PPIH: Sales 1% up (CCC +1 days, WC +3%)
Inventory +1 day
Fast Retailing: Sales10% down (CCC +15 days, WC -3%) Inventory +29 days
Toyota Motors: Sales 10% down (CCC -3 days, WC -18%) Inventory +7 days
Yamazaki Baking: Sales 5% down
(CCC+1 days, WC -4%) Inventory +1 day
Panasonic: Sales11% down (CCC +2 days, WC-7%) Inventory -4 days
In order to build a corporate structure that responds to change, it is necessary to manage change points by narrowing the pitch rather than managing goals. To that end, it is urgent to align the common operation cycle weekly, chain conventional management indicators (financial indicators and non-financial indicators) and manage the cockpit with the idea of the Balanced Scorecard.
For further details,